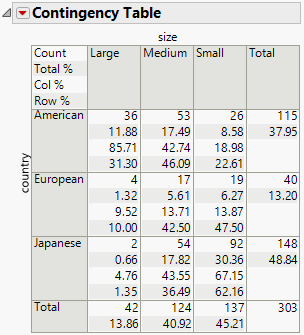
The Contingency Table is a two-way frequency table. There is a row for each level of the X variable and a column for each level of the Y variable.
Figure 7.6 Example of a Contingency Table

Note the following about contingency tables:
• The Count, Total%, Col%, and Row% correspond to the data within each cell that has row and column headings.
• The last column contains the total counts and percentages for each row.
• The bottom row contains total counts and percentages for each column.
In Figure 7.6, focus on the cars that are large and come from America. The following table explains the conclusions that you can make about these cars using the contingency table.
Table 7.1 Conclusions Based on Example of a Contingency Table
Number of cars that are both large and come from America.
Percentage of all 303 cars that are both large and come from America (36/303).
Percentage of the 42 large cars that come from America (36/42).
Percentage of the 115 American cars that are large (36/115).
Percentage of all 303 cars that come from America (115/303).
Percentage of all 303 cars that are large (42/303).
• To show or hide statistics in the Contingency Table, from the Contingency Table red triangle menu, select the statistic that you want to show or hide.
• To change the format of statistics in the Contingency Table, right-click the value in the table and select Format.
In the Contingency platform, the Contingency Table contains the following statistics:
The cell frequency, margin total frequencies, and grand total. The grand total is also the total sample size.
The percent of cell counts and margin totals relative to the grand total.
The percent of each cell count relative to its row total.
The percent of each cell count relative to its column total.
The expected frequency ( E ) of each cell under the assumption of independence. Computed as the product of the corresponding row total and column total divided by the grand total.
The observed cell frequency ( O ) minus the expected cell frequency ( E ).
The chi-square values computed for each cell as ( O - E ) 2 / E .
The cumulative column total, calculated from the top of the table to the bottom.
The cumulative column percentage, calculated from the top of the table to the bottom.
The cumulative row total, calculated from the left of the table to the right.
The cumulative row percentage, calculated from the left of the table to the right.
Make Into Data Table
Creates a new data table that contains the statistics that currently appear in the contingency table.
Opens a window that enables you to change the formatting of the statistics in the contingency table.